The Department of Health and Human Services sets the poverty threshold at $25,100 for a family of four in the contiguous United States. While the hardships associated with such financial strain are significant and pervasive, about 5.5 million Americans living in poverty face the additional strain that comes with living in an extremely poor neighborhood -- one with a poverty rate of 40 percent or greater.
Despite near record-low unemployment, a booming stock market, and nearly the longest period of sustained economic growth in U.S. history, conditions are not improving for all Americans. The share of Americans living in poverty climbed from 13.8 percent to 15.1 percent between 2010 and 2016.
Encouragingly, the share of Americans living both below the poverty line and in a neighborhood with a poverty rate of at least 40 percent -- referred to as concentrated poverty or extreme poverty -- declined from 14.0 percent to 11.6 percent. However, some cities did not track with the national trend. In 41 states there was at least one metro area that reported an uptick in concentrated poverty between 2010 and 2016.
In an exchange with 24/7 Wall Street, Alan Berube, senior fellow and deputy director for the Metropolitan Policy Program at nonprofit public policy organization Brookings Institution, explained the problems extreme poverty can pose. ��People who live in concentrated poverty have to deal not only with the challenges their own low incomes bring, but also with the challenges of their neighbors' low incomes,�� Berube said. Such challenges can include fewer job opportunities, stressed schools, elevated crime, and inadequate public infrastructure and health services.
Using data from the U.S. Census Bureau, 24/7 Wall Street compared the percentage point change in concentrated poverty rates in U.S. metro areas in each state between 2010 and 2016 to identify the cities where concentrated poverty is increasing the most. Despite spanning cities from coast to coast, neighborhoods facing extreme poverty tend to share multiple characteristics.
More:Population migration patterns: US cities Americans are abandoning
Alabama: Dothan2010-2016 increase in concentrated poverty: +4.5 ppts (4.0% to 8.5%)2010-2016 increase in concentrated poverty: +1,452 people (920 to 2,372)2010-2016 avg. annual GDP growth: +0.0% (Alabama: +0.8%)Unemployment: 22.6% (poor neighborhoods) 8.2% (all other)
The share of poor residents in the Dothan, Alabama, metro area living in neighborhoods with at least a 40% poverty rate -- also referred to as the concentrated poverty rate -- rose from 4.0% in 2010 to 8.5% in 2016, the largest increase of any city in the state. Over the same period, the statewide concentrated poverty rate rose from 10.4% to 14.1%, one of the larger increases of any state.
Areas with high concentrations of low-income families and individuals often face a range of challenges, including lower quality schools, limited access to health care, higher crime rates, and fewer job opportunities. As the share of poor residents living in poor neighborhoods in Dothan rose over the past several years, so did the unemployment rate in extreme poverty areas. While the unemployment rate outside of extreme poverty tracts in Dothan rose slightly from 7.3% in 2010 to 8.2% in 2016, the jobless rate in extreme poverty tracts rose from 16.2% to 22.6%.
Alaska: no city with concentrated poverty increase
Poverty is relatively uncommon in Alaska. The state's poverty rate of 9.9% is well below the national rate of 15.1%. In its two major metropolitan areas, Anchorage and Fairbanks, there has not been a single census poverty tract in which more than 40% of the population lives in poverty in either 2010 or 2016. The overall poverty rates in those two metro areas are 8.5% and 7.8%, respectively.

3. Arizona: Flagstaff • 2010-2016 increase in concentrated poverty: +13.6 ppts (0.0% to 13.6%) • 2010-2016 increase in concentrated poverty: +3,823 people (0 to 3,823) • 2010-2016 avg. annual GDP growth: +0.9% (Arizona: +1.7%) • Unemployment: 14.0% (poor neighborhoods) 7.5% (all other) Two neighborhoods in the Flagstaff metro area crossed the extreme poverty threshold -- a poverty rate of at least 40% -- between 2010 and 2016. Some 13.6% of Flagstaff's 28,200 poor residents live in those two neighborhoods, higher than the national concentrated poverty rate of 11.6% yet far less than Arizona's concentrated poverty rate of 21.7%. As is the case in most metro areas on this list, economic growth has been slow in Flagstaff. From 2010 to 2016, Flagstaff's economy grew at an average annual rate of just 0.9%, below the comparable growth rates statewide of 1.7% and nationwide of 2.0%. (Photo: Thinkstock)
Arizona: Flagstaff2010-2016 increase in concentrated poverty: +13.6 ppts (0.0% to 13.6%)2010-2016 increase in concentrated poverty: +3,823 people (0 to 3,823)2010-2016 avg. annual GDP growth: +0.9% (Arizona: +1.7%)Unemployment: 14.0% (poor neighborhoods) 7.5% (all other)
Two neighborhoods in the Flagstaff metro area crossed the extreme poverty threshold -- a poverty rate of at least 40% -- between 2010 and 2016. Some 13.6% of Flagstaff's 28,200 poor residents live in those two neighborhoods, higher than the national concentrated poverty rate of 11.6% yet far less than Arizona's concentrated poverty rate of 21.7%.
As is the case in most metro areas on this list, economic growth has been slow in Flagstaff. From 2010 to 2016, Flagstaff's economy grew at an average annual rate of just 0.9%, below the comparable growth rates statewide of 1.7% and nationwide of 2.0%.
Arkansas: Hot Springs2010-2016 increase in concentrated poverty: +12.6 ppts (4.9% to 17.5%)2010-2016 increase in concentrated poverty: +2,621 people (812 to 3,433)2010-2016 avg. annual GDP growth: -0.6% (Arkansas: +1.2%)Unemployment: 16.2% (poor neighborhoods) 8.4% (all other)
The number of neighborhoods in which at least 40% of residents live in poverty the Hot Springs metro area rose from one in 2010 to three in 2016. Over the same period, the share of poor residents living within such neighborhoods in the metro area rose from 4.9% to 17.5%, the largest increase of any city in Arkansas.
Individuals living in concentrated poverty areas are less likely to complete high school and college. While in 2010 Hot Springs was one of the few metro areas nationwide in which college attainment was actually higher within extreme poverty tracts than outside, this has reversed as concentrated poverty increased over the last several years. Today, some 15.5% of adults within extreme poverty neighborhoods in Hot Springs have a bachelor's degree, compared to 21.0% outside the city's extreme poverty neighborhoods.
California: Visalia-Porterville2010-2016 increase in concentrated poverty: +17.5 ppts (14.4% to 31.9%)2010-2016 increase in concentrated poverty: +26,603 people (13,945 to 40,548)2010-2016 avg. annual GDP growth: +2.4% (California: +3.0%)Unemployment: 14.8% (poor neighborhoods) 9.7% (all other)
In the Visalia-Porterville metro area, the number of neighborhoods where at least 40% of the population lives in poverty more than doubled between 2010 and 2016, increasing from 6 to 16. Over the same period, the share of poor residents living in such neighborhoods rose from 14.4% to 31.9% -- the largest increase of any city in California, and today one of the highest concentrated poverty rates in the nation.
Individuals in low-income areas are far less likely to complete high school and college. While some 16.0% of adults living outside of extreme poverty neighborhoods in Visalia-Porterville have a bachelor's degree, just 4.5% do in the city's extreme poverty neighborhoods.
More:Which manufacturers are bringing the most jobs back to America?
Colorado: Boulder2010-2016 increase in concentrated poverty: +10.4 ppts (0.0% to 10.4%)2010-2016 increase in concentrated poverty: +4,234 people (0 to 4,234)2010-2016 avg. annual GDP growth: +2.2% (Colorado: +2.7%)Unemployment: 7.2% (poor neighborhoods) 5.3% (all other)
As recently as 2010, there were no neighborhoods in the Boulder metro area with poverty rates of 40% or above. As of 2016, however, over 4,000 low-income Boulder residents lived in such neighborhoods. Boulder's poorest neighborhoods are characterized by widespread joblessness. The unemployment rate across the metro area's high poverty neighborhoods of 7.2% is far higher than the jobless rate of 5.3% in the the city's remaining neighborhoods.
Concentrated poverty increased in Boulder as the metro area's economy expanded slower than the state's as a whole. Boulder's average annual GDP growth of 2.2% from 2010 to 2016 is half a percentage point below the 2.7% average annual growth across Colorado.
Connecticut: Norwich-New London2010-2016 increase in concentrated poverty: +5.9 ppts (0.0% to 5.9%)2010-2016 increase in concentrated poverty: +1,519 people (0 to 1,519)2010-2016 avg. annual GDP growth: -0.5% (Connecticut: -0.5%)Unemployment: 9.2% (poor neighborhoods) 7.6% (all other)
Some of Norwich-New London's poorest residents have become increasingly economically isolated in the last few years. As recently as 2010, none of the city's low-income residents lived in neighborhoods with poverty rates of 40% or above. Now, about 1,500 do.
Poor neighborhoods are often characterized by low educational attainment rates, and the Norwich-New London metro area is no exception. Just 22.2% of area adults have a bachelor's degree, and only 72.6% have a high school diploma -- well below the respective 32.5% and 91.8% shares across the metro area's remaining neighborhoods.
Delaware: no city with concentrated poverty increase
While concentrated poverty tends to be worse in urban areas, Delaware's only metro area is not home to any extreme poverty neighborhoods. The Dover metro area has an overall poverty rate of 13.2%, less than the 15.1% national poverty rate but above the state rate of just 11.7%. Still Delaware is home to four neighborhoods where the poverty rate is at least 40%. Some 4.5% of the Delaware's poor residents live in such extreme poverty neighborhoods -- an increase from the state's concentrated poverty rate of 4.0% in 2010 yet far below the 11.6% national concentrated poverty rate.

9. Florida: Sebring • 2010-2016 increase in concentrated poverty: +27.2 ppts (0.0% to 27.2%) • 2010-2016 increase in concentrated poverty: +5,136 people (0 to 5,136) • 2010-2016 avg. annual GDP growth: -0.6% (Florida: +2.0%) • Unemployment: 16.4% (poor neighborhoods) 11.7% (all other) While Florida's poverty rate fell from 16.5% in 2010 to 14.7% in 2016, the poverty rate in the Sebring metro area rose from 16.9% to 19.4%. Two neighborhoods in Sebring crossed the threshold into extreme poverty over that time, and they are now home to 27.2% of the city's poor population -- the highest concentrated poverty rate in Florida. The jump in concentrated poverty from 0.0% to 27.2% between 2010 and 2016 was the largest increase of any metro area nationwide and more than 10 times the percentage point increase in concentrated poverty for Florida as a whole. (Photo: Thinkstock)
Florida: Sebring2010-2016 increase in concentrated poverty: +27.2 ppts (0.0% to 27.2%)2010-2016 increase in concentrated poverty: +5,136 people (0 to 5,136)2010-2016 avg. annual GDP growth: -0.6% (Florida: +2.0%)Unemployment: 16.4% (poor neighborhoods) 11.7% (all other)
While Florida's poverty rate fell from 16.5% in 2010 to 14.7% in 2016, the poverty rate in the Sebring metro area rose from 16.9% to 19.4%. Two neighborhoods in Sebring crossed the threshold into extreme poverty over that time, and they are now home to 27.2% of the city's poor population -- the highest concentrated poverty rate in Florida. The jump in concentrated poverty from 0.0% to 27.2% between 2010 and 2016 was the largest increase of any metro area nationwide and more than 10 times the percentage point increase in concentrated poverty for Florida as a whole.
Georgia: Macon2010-2016 increase in concentrated poverty: +14.4 ppts (30.3% to 44.7%)2010-2016 increase in concentrated poverty: +10,386 people (13,428 to 23,814)2010-2016 avg. annual GDP growth: +0.7% (Georgia: +2.3%)Unemployment: 22.4% (poor neighborhoods) 7.9% (all other)
While nationwide the share of poor Americans living in poor neighborhoods fell from 14.0% in 2010 to 11.6% in 2016, the concentrated poverty rate in Macon rose from 30.3% to 44.7%. The 14.4 percentage-point increase was the largest of any metro area in Georgia and pushed Macon's concentrated poverty rate from the 11th highest in the nation to third highest.
Concentrated poverty is far more common among minority populations. While just 10.5% of poor white residents in Macon live in poor neighborhoods, 58.2% of poor black residents and 44.1% of poor Hispanic residents do.
Hawaii: no city with concentrated poverty increase
Neither of Hawaii's two metro areas had an increase in concentrated poverty from 2010 to 2016. The Kahului-Wailuku-Lahaina metro area has no neighborhoods where the poverty rate is 40% or higher, and the number of extreme poverty neighborhoods in the Urban Honolulu metro area fell from five to two over that period. The share of poor residents living in extreme poverty neighborhoods in Urban Honolulu fell from 5.3% to 2.3%, greater than the 2.4 percentage-point decline in concentrated poverty nationwide. The concentrated poverty rate for Hawaii as a whole remains unchanged at 4.4%, the 10th lowest concentrated poverty rate of any state.
More:Per capita government spending: How much does your state spend on you?
Idaho: Pocatello2010-2016 increase in concentrated poverty: +15.9 ppts (0.0% to 15.9%)2010-2016 increase in concentrated poverty: +2,363 people (0 to 2,363)2010-2016 avg. annual GDP growth: -0.2% (Idaho: +1.9%)Unemployment: 9.7% (poor neighborhoods) 6.9% (all other)
Each of Idaho's five metro areas recorded an uptick in poverty between 2010 and 2016 -- but in none poverty increased as much as that of Pocatello. Located in the Southeastern Idaho, the metro area's poverty rate of 18.3% is up from 13.8% in 2010. Due in part to Pocatello's climbing poverty rate, the metro area is now home to two neighborhoods in which at least 40% of residents live in poverty. Increasing poverty is likely due in part to a stagnant economy. The metro area's average annual economic growth rate from 2010 to 2016 was -0.2%, compared to the 1.9% average annual growth rate across the state as a hole.
Boise City is the only other metro area in the state with extremely poor neighborhoods. Some 6,800 Boise City residents live on poverty level income and in neighborhoods where at least 40% of the population also lives on poverty level incomes
Illinois: Decatur2010-2016 increase in concentrated poverty: +14.1 ppts (26.3% to 40.3%)2010-2016 increase in concentrated poverty: +3,484 people (4,435 to 7,919)2010-2016 avg. annual GDP growth: -0.9% (Illinois: +1.3%)Unemployment: 20.5% (poor neighborhoods) 8.6% (all other)
While nationwide the share of poor Americans living in poor neighborhoods fell from 14.0% in 2010 to 11.6% in 2016, the concentrated poverty rate in the Decatur metro area rose from 26.3% to 40.3%. The 14.1 percentage-point increase was the largest of any metro area in Illinois and pushed Decatur's concentrated poverty rate from 23rd to seventh highest in the nation.
People living in low-income neighborhoods face a wide range of obstacles to good health, education, and economic mobility. In Decatur's poor neighborhoods, just 9.3% of adults have a bachelor's degree, and 20.5% of the labor force is unemployed. Outside of the city's poor neighborhoods, 25.0% of adults have a bachelor's degree and 8.6% of the labor force is unemployed.
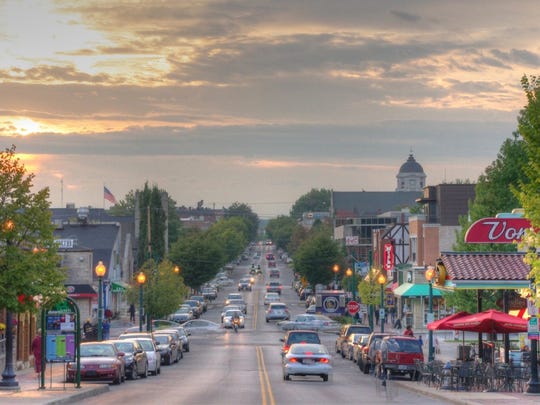
14. Indiana: Bloomington • 2010-2016 increase in concentrated poverty: +15.0 ppts (0.0% to 15.0%) • 2010-2016 increase in concentrated poverty: +5,263 people (0 to 5,263) • 2010-2016 avg. annual GDP growth: -0.8% (Indiana: +1.4%) • Unemployment: 8.6% (poor neighborhoods) 6.0% (all other) Bloomington's 23.5% poverty rate is by far the highest of any metro area in Indiana and well above the U.S. poverty rate of 15.1%. Some 15% of those more than 35,100 poor Bloomington residents live in extreme poverty. Like many other metro areas on this list, Bloomington has not benefited from the same economic growth that the country as a whole has enjoyed in recent years. Bloomington's GDP contracted by an annual average of 0.8% between 2010 and 2016, compared to a national 2.0% average annual growth rate and Indiana's 1.4% average GDP growth rate. ALSO READ: Cities Where Crime Is Soaring in Every State (Photo: Yahala / Wikimedia Commons)
Indiana: Bloomington2010-2016 increase in concentrated poverty: +15.0 ppts (0.0% to 15.0%)2010-2016 increase in concentrated poverty: +5,263 people (0 to 5,263)2010-2016 avg. annual GDP growth: -0.8% (Indiana: +1.4%)Unemployment: 8.6% (poor neighborhoods) 6.0% (all other)
Bloomington's 23.5% poverty rate is by far the highest of any metro area in Indiana and well above the U.S. poverty rate of 15.1%. Some 15% of those more than 35,100 poor Bloomington residents live in extreme poverty. Like many other metro areas on this list, Bloomington has not benefited from the same economic growth that the country as a whole has enjoyed in recent years. Bloomington's GDP contracted by an annual average of 0.8% between 2010 and 2016, compared to a national 2.0% average annual growth rate and Indiana's 1.4% average GDP growth rate.
Iowa: Dubuque2010-2016 increase in concentrated poverty: +10.1 ppts (0.0% to 10.1%)2010-2016 increase in concentrated poverty: +1,169 people (0 to 1,169)2010-2016 avg. annual GDP growth: +1.8% (Iowa: +2.6%)Unemployment: 5.1% (poor neighborhoods) 4.0% (all other)
While Dubuque is one of the wealthier metro areas nationwide, over the past several years poverty in the area has become more common and concentrated. Today, the city has one neighborhood in which at least 40% of residents live at or below the poverty line, compared to no such neighborhoods in 2010. Some 10.1% of Dubuque's poor population resides in the city's extreme poverty tract, the highest concentrated poverty rate of any Iowa metro area. Dubuque's overall poverty rate rose from 9.1% in 2010 to 12.5% in 2016.
Kansas: Manhattan2010-2016 increase in concentrated poverty: +9.9 ppts (0.0% to 9.9%)2010-2016 increase in concentrated poverty: +1,631 people (0 to 1,631)2010-2016 avg. annual GDP growth: +0.8% (Kansas: +1.5%)Unemployment: 7.7% (poor neighborhoods) 6.1% (all other)
While as of 2010 Manhattan, Kansas, was not home to any extreme poverty neighborhoods -- in which at least 40% of the population lives in poverty -- one census tract crossed that threshold during the past several years. Today, some 9.9% of the metro area's poor population lives in its extreme poverty neighborhood, located in Riley County in downtown Manhattan, the second highest concentrated poverty rate in Kansas.
It can be very difficult for individuals living in poor neighborhoods to get a good education. In Manhattan, however, the presence of Kansas State University may be the reason for the small educational attainment gap between low and high income areas. Some 39.9% of adults within extreme poverty neighborhoods in Manhattan, and 41.2% of adults outside of the city's extreme poverty neighborhoods, have a bachelor's degree, each among the highest such college attainment rates nationwide.
Kentucky: Owensboro2010-2016 increase in concentrated poverty: +9.6 ppts (0.0% to 9.6%)2010-2016 increase in concentrated poverty: +1,800 people (0 to 1,800)2010-2016 avg. annual GDP growth: +0.5% (Kentucky: +0.8%)Unemployment: 18.3% (poor neighborhoods) 6.4% (all other)
While the Owensboro metro area had no extreme poverty neighborhoods several years ago, today there is one neighborhood in the city where at least 40% of residents live at or below the poverty line. Some 9.6% of the metro area's poor population lives in the city's extreme poverty neighborhood, one of the lower concentrated poverty rates in Kentucky yet a major increase from 2010.
Individuals in low-income areas are less likely to have access to education and employment opportunities. Just 5.3% of adults living in Owensboro's poor neighborhoods have a bachelor's degree, and 18.3% of the labor force is unemployed. Outside of the city's poor neighborhoods, 19.9% of adults have a bachelor's degree, and only 6.4% of the labor force is unemployed.
More:Wage potential: Highest paying jobs you can get without a college degree
Louisiana: Monroe2010-2016 increase in concentrated poverty: +6.7 ppts (31.6% to 38.2%)2010-2016 increase in concentrated poverty: +4,400 people (11,316 to 15,716)2010-2016 avg. annual GDP growth: +0.1% (Louisiana: -1.0%)Unemployment: 16.4% (poor neighborhoods) 6.1% (all other)
The share of poor Monroe residents living in neighborhoods where at least 40% of the population earns poverty wages rose from 31.6% in 2010 to 38.2% in 2016, the largest increase of any metro area in Louisiana. Concentrated poverty is far more prevalent among minority populations. While just 9.7% of poor white residents in Monroe live in extreme poverty neighborhoods, some 55.5% of the metro area's poor black residents live in extreme poverty neighborhoods.
Income segregation can also create large disparities in education, unemployment, and other socioeconomic indicators. Just 8.4% of adults living in Monroe's poor neighborhoods have a bachelor's degree, far less than the 25.6% college attainment rate in the metro area's remaining neighborhoods.
(Photo: Thinkstock)
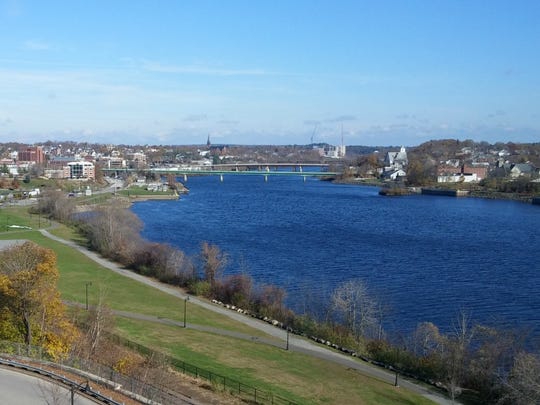
Maine: Bangor2010-2016 increase in concentrated poverty: +4.9 ppts (6.1% to 11.0%)2010-2016 increase in concentrated poverty: +1,221 people (1,394 to 2,615)2010-2016 avg. annual GDP growth: +0.1% (Maine: +0.4%)Unemployment: 10.2% (poor neighborhoods) 7.1% (all other)
Bangor's poverty rate rose from 15.7% in 2010 to 16.3% in 2016. As poverty became more common in the metro area, it also became more concentrated. The share of poor city residents living in extreme poverty neighborhoods rose from 6.1% in 2010 to 11.0% in 2016, the largest increase in Maine.
The concentration of poverty can impede upward income mobility and limit positive outcomes in education, employment, and homeownership. While some 71.0% of heads of household own their homes outside of extreme poverty neighborhoods in Bangor, the homeownership rate is just 34.8% within the city's poorest neighborhoods.
Maryland: Hagerstown-Martinsburg2010-2016 increase in concentrated poverty: +2.9 ppts (3.7% to 6.6%)2010-2016 increase in concentrated poverty: +1,245 people (901 to 2,146)2010-2016 avg. annual GDP growth: +1.5% (Maryland: +1.3%)Unemployment: 15.0% (poor neighborhoods) 7.8% (all other)
The share of poor residents living in extreme poverty neighborhoods in the Hagerstown-Martinsburg metro area nearly doubled over the past several years, rising from 3.7% in 2010 to 6.6% in 2016. Despite the increase, Hagerstown's concentrated poverty rate remains well below the 11.6% national figure.
Segregation by income in an urban area often leads to large disparities in education and employment. Just 9.7% of adults in Hagerstown's poor neighborhoods have a bachelor's degree, far less than the 20.4% college attainment rate in the metro area's non-extreme poverty neighborhoods. Similarly, 15.0% of the labor force in extreme poverty neighborhoods are unemployed, compared to the 7.8% unemployment rate in the metro area's remaining neighborhoods.
Massachusetts: Springfield2010-2016 increase in concentrated poverty: +9.9 ppts (23.8% to 33.6%)2010-2016 increase in concentrated poverty: +11,781 people (22,014 to 33,795)2010-2016 avg. annual GDP growth: +1.2% (Massachusetts: +1.8%)Unemployment: 18.1% (poor neighborhoods) 7.3% (all other)
The number of neighborhoods in the Springfield metro area in which at least 40% of the population lives in poverty rose from 14 in 2010 to 19 in 2016. The share of the metro area's 100,400 poor residents living in those neighborhoods rose from 23.8% to 33.6% over the same period, the largest increase of any metro area in Massachusetts. Springfield's concentrated poverty rate is now more than three times greater than the state's 10.9% concentrated poverty rate.
The concentration of poor residents in high poverty neighborhoods can hinder upward income mobility and reduce positive outcomes in education, employment, and homeownership. In Springfield's extreme poverty neighborhoods, just 18.9% of heads of household own their homes, 14.0% of adults have a bachelor's degree, and 18.1% of the labor force is unemployed. Outside of the city's extreme poverty neighborhoods, 68.1% of heads of household own their homes, 32.3% of adults have a bachelor's degree, and unemployment stands at 7.3%.
Michigan: Jackson2010-2016 increase in concentrated poverty: +12.5 ppts (20.8% to 33.3%)2010-2016 increase in concentrated poverty: +3,595 people (4,740 to 8,335)2010-2016 avg. annual GDP growth: +1.4% (Michigan: +2.0%)Unemployment: 19.7% (poor neighborhoods) 7.6% (all other)
Of the 38 Census tracts in the Jackson, Michigan, metro area, seven have poverty rates of 40% and above, up from five in 2010. The number of poor Jackson metro area residents living in extremely poor neighborhoods nearly doubled from 4,740 in 2010 to 8,335 in 2016.
Poorer neighborhoods are typically home to less educated populations, and the poorest parts of Jackson are no exception. Just 12.3% of adults in the metro area's poorest neighborhoods have a bachelor's degree, and 79.9% have a high school diploma -- compared to 21.4% and 90.7% of adults in Jackson's remaining neighborhoods.
Minnesota: St. Cloud2010-2016 increase in concentrated poverty: +17.1 ppts (0.0% to 17.1%)2010-2016 increase in concentrated poverty: +4,313 people (0 to 4,313)2010-2016 avg. annual GDP growth: +2.5% (Minnesota: +2.0%)Unemployment: 6.7% (poor neighborhoods) 4.5% (all other)
While in 2010 St. Cloud had no extreme poverty tracts, one neighborhood crossed that threshold over the past several years. The city's extreme poverty neighborhood is home to 17.1% of the city's poor population -- the highest rate of concentrated poverty in Minnesota and more than twice the state's concentrated poverty rate of 8.3%.
While individuals in low-income areas tend to have less educational attainment than those in high-income areas, the presence of St. Cloud State University can help explain the smaller achievement gap between the two demographics in the metro area. Some 24.4% of adults in St. Cloud's extreme poverty neighborhoods have a bachelor's degree, nearly in line with the 25.1% college attainment rate outside of the city's extreme poverty neighborhoods.
(Photo: Thinkstock)
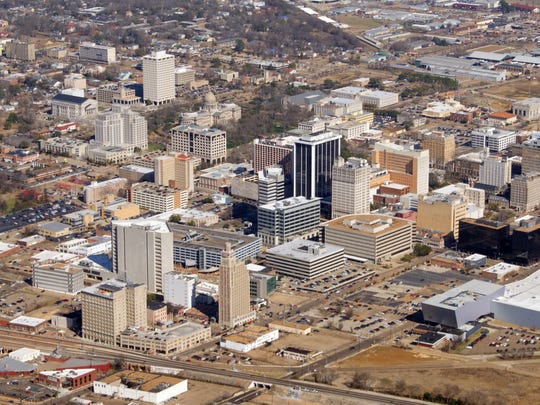
Mississippi: Jackson2010-2016 increase in concentrated poverty: +6.0 ppts (25.6% to 31.6%)2010-2016 increase in concentrated poverty: +8,948 people (25,829 to 34,777)2010-2016 avg. annual GDP growth: +1.0% (Mississippi: +0.4%)Unemployment: 17.7% (poor neighborhoods) 7.5% (all other)
Both the poverty rate and concentrated poverty rate in Jackson, Mississippi, increased in recent years. Nearly 32% of the 110,000 Jackson residents who below the poverty line live in neighborhoods in which over 40% of the population is poor. In 2010, 25.6% of the metro area's 101,000 residents living below the poverty line lived in extremely poor neighborhoods. Over that same period, economic growth was relatively slow in Jackson. Average annual GDP growth in the metro area was just 1% between 2010 and 2016, half the comparable national growth rate.
As is often the case in poor neighborhoods nationwide, joblessness is a considerable problem in parts of Jackson. Across the metro area's 24 census tracts with high concentrations of poverty, 17.7% of the workforce are unemployed.
More:How much did a personal computer cost the year you were born?
Missouri: Cape Girardeau2010-2016 increase in concentrated poverty: +14.5 ppts (13.1% to 27.6%)2010-2016 increase in concentrated poverty: +3,241 people (1,830 to 5,071)2010-2016 avg. annual GDP growth: +0.4% (Missouri: +0.5%)Unemployment: 16.5% (poor neighborhoods) 4.7% (all other)
The share of Cape Girardeau's poor residents living in extreme poverty neighborhoods -- in which at least 40% of residents are also poor -- more than doubled over the last several years, from 13.1% in 2010 to 27.6% in 2016. The increase in concentrated poverty was particularly stark for the metro area's black residents. The share of poor black residents living in extreme poverty neighborhoods rose from 45.3% in 2010 to 78.1% in 2016, the highest black concentrated poverty rate of any U.S. city and nearly eight times the 9.8% national figure.
Montana: Great Falls2010-2016 increase in concentrated poverty: +10.7 ppts (0.0% to 10.7%)2010-2016 increase in concentrated poverty: +1,254 people (0 to 1,254)2010-2016 avg. annual GDP growth: +0.9% (Montana: +1.8%)Unemployment: 5.1% (poor neighborhoods) 5.0% (all other)
The number of Great Falls residents living in poverty climbed from about 10,600 to nearly 11,700 between 2010 and 2016. The increase was not spread evenly across the city, however. There were no neighborhoods with a 40% or greater concentration of poverty in Great Falls in 2010. But as of 2016, 1,254 of poor metro area residents lived in a region with highly concentrated poverty.
More poverty and higher concentrations of it are likely due in part to a sluggish economy. Great Falls' average annual GDP growth rate of 0.9% since 2010 is below both the state 1.8% rate and the national 2.0% average economic growth rate.
Nebraska: Omaha-Council Bluffs2010-2016 increase in concentrated poverty: +5.5 ppts (4.9% to 10.4%)2010-2016 increase in concentrated poverty: +6,429 people (4,444 to 10,873)2010-2016 avg. annual GDP growth: +2.1% (Nebraska: +2.3%)Unemployment: 14.6% (poor neighborhoods) 4.3% (all other)
As recently as 2010, fewer than 5% of Omaha-Council Bluffs' poorest residents lived in extremely poor communities. But as of 2016, over 10% do. A lack of available jobs likely prevents some of those living in poor neighborhoods from pulling themselves out of poverty. The jobless rate across the nine neighborhoods with a high concentration of poverty is just shy of 15% -- more than triple the 4.3% unemployment rate in the rest of the city.
Despite reporting the greatest uptick in concentrated poverty since 2010, Omaha has the lowest poverty rate of Nebraska's three metro areas. Some 11.8% of Omaha-Council Bluffs residents live below the poverty line compared to Grand Island's 13.4% poverty and Lincoln's 14.0% rate.
(Photo: Thinkstock)
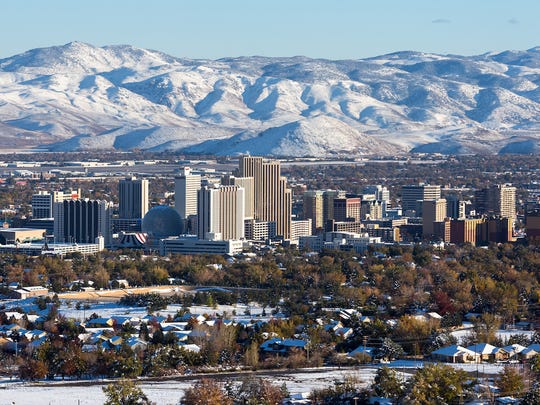
Nevada: Reno2010-2016 increase in concentrated poverty: +6.2 ppts (7.6% to 13.8%)2010-2016 increase in concentrated poverty: +5,088 people (3,899 to 8,987)2010-2016 avg. annual GDP growth: +2.7% (Nevada: +1.2%)Unemployment: 16.0% (poor neighborhoods) 7.6% (all other)
The share of the Reno metro area's poor population living in extreme poverty neighborhoods -- in which at least 40% of the population is also poor -- rose from 7.6% in 2010 to 13.8% in 2016, the largest increase of any city in Nevada. Over the same period, the metro area's poverty rate climbed from 12.5% to 14.9%.
The increase in concentrated poverty affected the area's black community the most. The share of Reno's poor black residents living in extreme poverty neighborhoods nearly tripled from 7.1% in 2010 to 21.0% in 2016.
New Hampshire: no city with concentrated poverty increase
Manchester-Nashua is the only major metropolitan area in New Hampshire. Currently, none of the metro area's poor residents live in extreme poverty, down from 4.2% in 2010. Strong economic growth may partially explain the decline of extreme poverty in the metro area. The Manchester-Nashua metro area's economy grew at an average rate of 2.3% per year from 2010 to 2016, compared to a 2.0% national growth rate and a 1.4% statewide rate over that time.
Across New Hampshire, just 7.3% of the population lives below the poverty line, the lowest poverty rate of any state in the country.
More:Are these the worst cities to live in? Study looks at quality of life across the U.S.
New Jersey: Trenton2010-2016 increase in concentrated poverty: +10.7 ppts (7.5% to 18.2%)2010-2016 increase in concentrated poverty: +4,556 people (2,669 to 7,225)2010-2016 avg. annual GDP growth: +1.5% (New Jersey: +0.8%)Unemployment: 21.3% (poor neighborhoods) 8.1% (all other)
While nationwide the share of Americans living in extreme poverty neighborhoods fell from 14.0% in 2010 to 11.6% in 2016, in Trenton the concentrated poverty rate more than doubled from 7.5% to 18.2%. The increase was the largest of any metro area in New Jersey, and pushed Trenton's concentrated poverty rate from second highest in the state to highest.
The concentration of poor residents in high poverty neighborhoods can hinder upward income mobility and contribute to geographic disparities in education, employment, and homeownership. In Trenton's extreme poverty neighborhoods, just 25.4% of heads of household own their homes, 10.0% of adults have a bachelor's degree, and 21.3% of the labor force is unemployed. Outside of the city's extreme poverty neighborhoods, 66.0% of heads of household own their homes, 41.5% of adults have a bachelor's degree, and 8.1% of the workforce is unemployed.
New Mexico: Farmington2010-2016 increase in concentrated poverty: +8.7 ppts (4.3% to 13.0%)2010-2016 increase in concentrated poverty: +2,118 people (1,113 to 3,231)2010-2016 avg. annual GDP growth: -0.2% (New Mexico: +0.6%)Unemployment: 17.9% (poor neighborhoods) 9.8% (all other)
A large portion of the Farmington, New Mexico, metropolitan area consists of the Navajo Nation reservation that extends into Arizona and Utah as well. This reservation, like the American native population in general, has long faced conditions that contribute to poverty and other socioeconomic difficulties. However, the area's concentrated poverty rate as of 2010 was relatively low, at just 4.3%, compared to a national rate of 14.0%. That rate rose by 8.7 percentage points since 2010, the largest uptick in concentrated poverty in the state. Farmington now has the second highest concentrated poverty rate of any metro area in New Mexico, trailing only Las Cruces.
(Photo: Stilfehler 19:28, 9 July 2007 (CEST) / Wikimedia Commons)
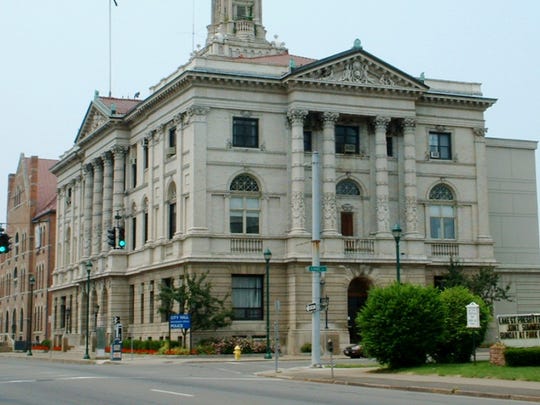
New York: Elmira2010-2016 increase in concentrated poverty: +19.6 ppts (18.2% to 37.8%)2010-2016 increase in concentrated poverty: +2,677 people (2,302 to 4,979)2010-2016 avg. annual GDP growth: -1.4% (New York: +1.2%)Unemployment: 10.9% (poor neighborhoods) 4.8% (all other)
Many cities in upstate New York struggle with slow and even negative economic growth and few U.S. metro areas reported a larger economic contraction than Elmira, New York. The metro area's GDP shrank by an annual average of 1.4% between 2010 and 2016, even as the state and national economies grew at average annual rates of 1.2% and 2.0%, respectively.
Over the same period, the share of poor metro area residents living in a neighborhood characterized by concentrated poverty more than doubled from 18.2% to 37.8%.
North Carolina: Greenville2010-2016 increase in concentrated poverty: +16.8 ppts (6.5% to 23.3%)2010-2016 increase in concentrated poverty: +7,232 people (2,415 to 9,647)2010-2016 avg. annual GDP growth: +1.6% (North Carolina: +1.4%)Unemployment: 14.2% (poor neighborhoods) 10.8% (all other)
The concentrated poverty rate in the Greenville metro area rose by 16.8 percentage points from 5.9% in 2010 to 23.3% in 2016, the largest increase of any city in North Carolina and the sixth largest nationwide. Greenville's concentrated poverty rate rose from eighth highest in North Carolina to the highest, and it is now more than double the 11.6% national figure.
While segregation of residents by income in urban areas can contribute to large geographic disparities in education, the presence of East Carolina University in Greenville likely helps reduce the achievement gap between high- and low-income neighborhoods. Some 27.8% of adults in Greenville's extreme poverty neighborhoods have a bachelor's degree, roughly in line with the 29.2% college attainment rate outside of the city's extreme poverty neighborhoods.
North Dakota: no city with concentrated poverty increase
Since 2010, concentrated poverty in North Dakota's three major metro areas has either remained unchanged or declined. The largest decline was in Bismarck, where the share of poor residents living in extreme poverty neighborhoods fell from 16.9% in 2010 to 0.0% in 2016. Meanwhile, the metro area's poverty rate fell from 10.5% to 9.0%.
Over the same period, the concentrated poverty rate for North Dakota as a whole fell from 4.5% to 2.5%, the largest decline of any state other than Vermont. One factor contributing to the decline in poverty in North Dakota was the state's oil production boom, which peaked in 2015. The state's average annual GDP growth rate of 5.5% between 2010 and 2016 is by far the highest of any state.
Ohio: Mansfield2010-2016 increase in concentrated poverty: +10.8 ppts (0.0% to 10.8%)2010-2016 increase in concentrated poverty: +2,027 people (0 to 2,027)2010-2016 avg. annual GDP growth: +0.7% (Ohio: +1.9%)Unemployment: 19.2% (poor neighborhoods) 7.9% (all other)
While in 2010 Mansfield had no extreme poverty neighborhoods -- in which at least 40% of the population lives in poverty -- two census tracts crossed that threshold over the last several years. Some 10.8% of the city's 19,000 poor residents now live in extreme poverty. While Mansfield experienced the largest increase in concentrated poverty of any metro in Ohio, the share of poor residents living in extreme poverty neighborhoods remains below the comparable share statewide of 17.6% and the share nationwide of 11.6%, and it is the lowest of any city in the state.
More:Who is getting paid more? 16 states where personal incomes are booming

(Photo: Thinkstock)
Oklahoma: Oklahoma City2010-2016 increase in concentrated poverty: +5.4 ppts (7.1% to 12.5%)2010-2016 increase in concentrated poverty: +12,025 people (12,396 to 24,421)2010-2016 avg. annual GDP growth: +2.7% (Oklahoma: +3.2%)Unemployment: 10.6% (poor neighborhoods) 5.1% (all other)
The number of extreme poverty neighborhoods -- in which at least 40% of residents live at or below the poverty line -- in Oklahoma City rose from 14 to 20 between 2010 and 2016. Over the same period, the share of the city's poor who live in such neighborhoods rose from 7.1% to 12.1%, the largest increase of any metro area in Oklahoma. The national concentrated poverty rate, meanwhile, fell from 14.0% to 11.6%.
Like in most major urban areas, there is a large geographic disparity in education between Oklahoma City's high- and low-income neighborhoods. While 29.9% of adults outside of extreme poverty neighborhoods in Oklahoma City have a bachelor's degree, just 9.0% of adults within extreme poverty neighborhoods do.
Oregon: Salem2010-2016 increase in concentrated poverty: +6.7 ppts (0.0% to 6.7%)2010-2016 increase in concentrated poverty: +4,412 people (0 to 4,412)2010-2016 avg. annual GDP growth: +2.3% (Oregon: +1.4%)Unemployment: 20.2% (poor neighborhoods) 9.0% (all other)
In the majority of metro areas in Oregon, concentrated poverty rates either declined or remained flat from 2010 to 2016. Salem is a notable exception. In 2010, there were no neighborhoods in the Salem metro area with poverty rates of 40% or above. As of 2016, there were two, home to just over 4,400 people living below the poverty line.
Concentrated poverty climbed in Salem despite relatively rapid economic growth in recent years. The metro area reported nearly the highest-in-the-state GDP growth rates of 5.0% in 2014 and and 6.6% in 2015, largely offsetting weaker growth in previous years. Between 2010 and 2016, the average annual economic growth in the metro area was 2.3% -- higher than the comparable national 2.0% growth rate and the statewide 1.4% average growth.
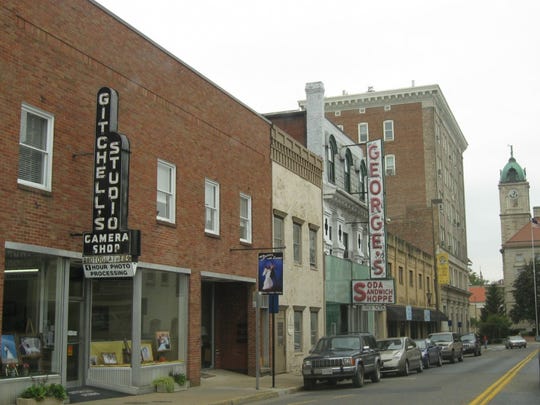
Pennsylvania: Johnstown2010-2016 increase in concentrated poverty: +14.2 ppts (8.3% to 22.5%)2010-2016 increase in concentrated poverty: +3,004 people (1,555 to 4,559)2010-2016 avg. annual GDP growth: -1.6% (Pennsylvania: +1.7%)Unemployment: 17.6% (poor neighborhoods) 7.8% (all other)
While the national concentrated poverty rate fell from 14.0% in 2010 to 11.6% in 2016, the share of poor residents living in extreme poverty neighborhoods in Johnstown rose from 8.3% to 22.5%, the largest increase of any metro area in Pennsylvania.
The increase in concentrated poverty affected the city's minority population the most. While the white concentrated poverty rate in Johnstown rose from 6.8% in 2010 to 15.0% in 2016, the black concentrated poverty rate rose from 23.6% to 71.5% -- today the highest such figure in Pennsylvania and the third highest in the nation.
Rhode Island: no city with concentrated poverty increase
While concentrated poverty nationwide has increased faster in suburban areas than in rural areas over the past several years, concentrated poverty in Rhode Island's one metro area fell even as it increased throughout the state as a whole. The share of poor residents living in extreme poverty neighborhoods in the Providence-Warwick metro area declined from 7.2% in 2010 to 5.4% in 2016, while the state's concentrated poverty rate rose from 6.9% to 7.2%. The overall poverty rate, however, increased from 11.9% to 13.4% in Providence and decreased from 14.0% to 12.8% for Rhode Island as a whole.
South Carolina: Greenville-Anderson-Mauldin2010-2016 increase in concentrated poverty: +2.6 ppts (10.5% to 13.1%)2010-2016 increase in concentrated poverty: +4,807 people (12,529 to 17,336)2010-2016 avg. annual GDP growth: +2.5% (South Carolina: +2.1%)Unemployment: 11.0% (poor neighborhoods) 7.1% (all other)
The share of poor residents in the Greenville-Anderson-Mauldin metro area who live in extreme poverty neighborhoods -- where at least 40% of the population is also poor -- rose from 10.5% in 2010 to 13.1% in 2016, the largest increase of any metro area in South Carolina.
While increases in concentrated poverty can contribute to large socioeconomic disparities between low- and high-income areas, the regional gap in unemployment actually fell in Greenville over the past several years. The 2010 unemployment rate of 17.9% for extreme poverty neighborhoods in Greenville was more than twice the 8.6% unemployment rate for the city's non-extreme poverty neighborhoods. Today, 11.0% of the labor force in extreme poverty neighborhoods is unemployed, compared to 7.1% outside of extreme poverty neighborhoods.

(Photo: Thinkstock)
South Dakota: no city with concentrated poverty increase
While the concentrated poverty rate in South Dakota as a whole rose from 14.6% in 2010 to 15.9% in 2016, the share of poor residents living in extreme poverty neighborhoods fell or remained unchanged in the state's metro areas. The largest decline occurred in the Rapid City metro area, where the concentrated poverty rate fell from 11.5% to 0.0%. While poverty became more concentrated in South Dakota, the state's overall poverty rate declined from 14.4% to 13.3%, even as the U.S. figure rose from 13.8% to 15.1%.
Tennessee: Cleveland2010-2016 increase in concentrated poverty: +15.1 ppts (6.5% to 21.6%)2010-2016 increase in concentrated poverty: +3,414 people (1,177 to 4,591)2010-2016 avg. annual GDP growth: +1.4% (Tennessee: +2.5%)Unemployment: 20.2% (poor neighborhoods) 8.3% (all other)
While the share of poor Americans living in extreme poverty neighborhoods nationwide fell from 14.0% in 2010 to 11.6% in 2016, the concentrated poverty rate in Cleveland rose from 6.5% to 21.6% -- the largest increase of any metro area in Tennessee and the ninth largest in the country.
Income segregation can contribute to large disparities in homeownership, employment, and other socioeconomic outcomes, particularly in urban areas. In Cleveland, just 32.2% of heads of household living in extreme poverty neighborhoods own their homes, and 20.2% of the labor force is unemployed. By comparison, 70.3% of heads of household outside of extreme poverty neighborhoods in the metro area own their homes, and 8.3% of the labor force is unemployed.
More:Public sector jobs: States where the most people work for the government
Texas: Laredo2010-2016 increase in concentrated poverty: +15.0 ppts (44.1% to 59.1%)2010-2016 increase in concentrated poverty: +18,464 people (31,275 to 49,739)2010-2016 avg. annual GDP growth: +0.8% (Texas: +3.6%)Unemployment: 7.0% (poor neighborhoods) 5.5% (all other)
The share of poor Laredo residents living in extreme poverty neighborhoods -- where at least 40% of residents live at or below the poverty line -- rose from 44.1% in 2010 to 59.1% in 2016. The increase was the largest of any metro area in Texas, the 10th largest of any city nationwide, and pushed Laredo's concentrated poverty rate from third highest in the country to the highest.
The rise in concentrated poverty affected the metro area's minority communities the most. While the concentrated poverty rate for white residents in Laredo rose from 35.2% in 2010 to 39.7% in 2016, the concentrated poverty rate for black residents rose from 27.7% to 62.4%, and for Hispanic residents from 44.4% to 59.7%.
Utah: Logan2010-2016 increase in concentrated poverty: +24.0 ppts (0.0% to 24.0%)2010-2016 increase in concentrated poverty: +4,546 people (0 to 4,546)2010-2016 avg. annual GDP growth: +1.3% (Utah: +2.9%)Unemployment: 6.5% (poor neighborhoods) 4.0% (all other)
While in 2010 the Logan metro area had no extreme poverty neighborhoods -- in which at least 40% of residents are poor -- two census tracts have crossed that threshold over the past several years. Today, some 24.0% of Logan's 19,000 poor residents live in extreme poverty -- the highest concentrated poverty rate of any Utah metro area.
Logan's increasing concentrated poverty rate may be partially the result of slower than average economic growth. Between 2010 and 2016, Logan's economy grew at an average annual rate of 1.3% -- the slowest of any metro area in the state and below the U.S. GDP growth of 2.0% for that time.
Vermont: no city with concentrated poverty increase
No metro areas in Vermont reported an increase in concentrated poverty from 2010 to 2016. Burlington-South Burlington, the state's only metro area, was home to two extreme poverty neighborhoods in 2010. However, the share of poor metro area residents living in neighborhoods where at least 40% of the population is poor declined from 15.0% to 0.0% as the two poorest tracts fell below the extreme poverty threshold. As a result, the concentrated poverty rate for Vermont as a whole fell from 4.1% to 0.0%, the largest decline of any state.
(Photo: dougtone / Flickr)
Virginia: Harrisonburg2010-2016 increase in concentrated poverty: +10.3 ppts (0.0% to 10.3%)2010-2016 increase in concentrated poverty: +2,444 people (0 to 2,444)2010-2016 avg. annual GDP growth: -0.4% (Virginia: +0.6%)Unemployment: 1.7% (poor neighborhoods) 5.1% (all other)
One neighborhood in the Harrisonburg metro area crossed the extreme poverty threshold between 2010 and 2016. Today, some 10.3% of the metro area's 23,600 poor residents live in that neighborhood, nearly twice the 5.6% concentrated poverty rate for Virginia as a whole.
As is often the case among the cities on this list, economic growth has been weak in Harrisonburg in recent years. The metro area's average annual GDP growth rate of -0.4% between 2010 and 2016 is below both the state annual growth rate of 0.6% and the national rate of 2.0%.
More:What's the richest town in every state?
Washington: Kennewick-Richland2010-2016 increase in concentrated poverty: +0.9 ppts (8.4% to 9.3%)2010-2016 increase in concentrated poverty: +752 people (2,952 to 3,704)2010-2016 avg. annual GDP growth: -0.6% (Washington: +2.9%)Unemployment: 13.7% (poor neighborhoods) 6.4% (all other)
While the share of poor Americans living in extreme poverty neighborhoods -- where at least 40% of residents also live below the poverty line -- fell from 14.0% in 2010 to 11.6% in 2016 nationwide, the concentrated poverty rate in the Kennewick-Richland metro area rose from 8.4% to 9.3%.
Low-income areas tend to have less access to education and employment opportunities than high-income areas. In Kennewick's extreme poverty neighborhood, just 8.0% of adults have a bachelor's degree and 13.7% of the labor force are unemployed. By comparison, 25.9% of adults have a bachelor's degree and 6.4% of the labor force is unemployed in the metro area's remaining neighborhoods.
West Virginia: Morgantown2010-2016 increase in concentrated poverty: +8.2 ppts (0.0% to 8.2%2010-2016 increase in concentrated poverty: +2,137 people (0 to 2,137)2010-2016 avg. annual GDP growth: +2.1% (West Virginia: +0.1%)Unemployment: 1.1% (poor neighborhoods) 6.3% (all other)
Since 2010, one neighborhood in Morgantown has crossed the 40% poverty rate threshold. Morgantown's extreme poverty neighborhood is home to 8.2% of the city's poor population, the second highest concentrated poverty rate of any metro area in West Virginia yet less than the 11.6% national figure.
While Morgantown's poor residents are not as densely concentrated in poor neighborhoods as many of the other U.S. cities where extreme poverty is on the rise, it is still one of the poorest metro areas nationwide. Overall, some 20.5% of Morgantown residents live in poverty, more than the 15.1% national poverty rate and the vast majority of U.S. metro areas.
(Photo: Thinkstock)
Wisconsin: Oshkosh-Neenah2010-2016 increase in concentrated poverty: +13.1 ppts (0.0% to 13.1%)2010-2016 increase in concentrated poverty: +2,559 people (0 to 2,559)2010-2016 avg. annual GDP growth: +1.5% (Wisconsin: +1.7%)Unemployment: 7.1% (poor neighborhoods) 4.3% (all other)
While in 2010 no neighborhoods in the Oshkosh-Neenah metro area met the criteria for extreme poverty, one census tract has crossed that threshold in the last several years. Oshkosh's extreme poverty neighborhood is home to 13.1% of the city's 20,000 poor residents, a higher concentrated poverty rate than both the state 12.3% rate and the national 11.6% rate.
Joblessness is a bigger problem in Oshkosh-Neenah's poorest neighborhood than it is in the rest of the metro area. Some 7.1% of the labor force living in the area's concentrated poverty neighborhood is unemployed, compared to 4.3% of the labor force living in the rest of the city.
Wyoming: no city with concentrated poverty increase
Wyoming is a relatively high-income state, and none of its census tracts meet the 40% poverty threshold required to be considered an extreme poverty neighborhood. Statewide, some 11.3% of Wyoming residents live at or below the poverty line, far less than the 15.1% national poverty rate and less than a majority of states.
Despite increasing over the last several years, poverty is less prevalent in Wyoming's two metro areas than it is statewide. The share of residents living in poverty in the Cheyenne metro area rose from 9.6% in 2010 to 10.4% in 2016, and in the Casper area from 8.4% to 10.5%.
CLOSE

The President��s economic approval rating has hit an all time high since he took office, a new Survey shows. Susana Victoria Perez has more. Buzz60
Detailed findings
The relationship between education and income has grown increasingly apparent in recent years. According to the Social Security Administration, the median lifetime earnings for men with a bachelor��s degree is $900,000 more than the median income for men with a high school diploma. Among women, the difference is $630,000.
This connection is apparent in the neighborhoods with high concentrated poverty rates. The national bachelor��s attainment rate in neighborhoods with concentrated poverty is 11.6%, compared to the 30.8% attainment rate in all other neighborhoods.
Joblessness also tends to be a bigger problem in extremely poor neighborhoods than in those with lower poverty rates. Unemployment is higher in the poorest neighborhoods than it is in the remaining parts of the city in all but two metro areas on this list. In neighborhoods without concentrated poverty, the average annual unemployment rate is 7.2%. In concentrated poverty neighborhoods, unemployment averages 16.4%.
Declining job availability may partially explain the upticks in concentrated poverty. In the majority of metro areas on this list for which comparable data is available, unemployment in the poorest neighborhoods climbed between 2010 and 2016.
Both declining job availability and upticks in extreme poverty rates are often partially the result of weak economic growth. Eleven cities on this list reported negative average annual GDP growth between 2010 and 2016, even as the U.S. economy grew at an average rate of 2.0% over the same period.
Not all states are home to a metro area with upticks in concentrated poverty. Metro areas in Hawaii, New Hampshire, North Dakota, Rhode Island, South Dakota and Vermont reported declining rates of extreme poverty from 2010 to 2016.
Meanwhile, Alaska, Delaware, and Wyoming had no metro areas with extreme poverty neighborhoods in either 2010 or 2016.
More:25 richest cities in America: Does your metro area make the list?
Methodology
To identify the metropolitan areas where poverty is concentrating the fastest in each state, 24/7 Wall St. reviewed U.S. Census Bureau American Community Survey data on poverty rates at the tract level. We list for each state the metro area with the largest percentage point increase in residents living in extreme poverty. The concentrated poverty rate is the share of a metropolitan area��s poor population that lives in a census tract characterized by extreme poverty �� having a poverty rate of 40% or higher. The concentrated poverty rate was reviewed for 2010 �� represented as a five-year average for 2006-2010, and 2016 �� a five-year average for 2012-2016. Census tracts in which more than 50% of the population is enrolled in postsecondary school or where the total population is fewer than 500 were excluded from consideration of extreme poverty. We also reviewed other data from the American Community Survey, including educational attainment rates and unemployment rates for both groups in concentrated poverty and those not in poverty. These data are also averages of the 2006-2010 and 2012-2016 five-year periods. Average annual GDP growth came from the Bureau Economic Analysis.
24/7 Wall Street is a USA TODAY content partner offering financial news and commentary. Its content is produced independently of USA TODAY.


 For safety, the Cygnet V8 has a built-in roll cage, four-point seatbelts and a fire extuingisher.